
Roku app tracing (with Perfetto)
Record and visualize Roku app traces with Perfetto using VSCode or ECP
You can use Perfetto to record, analyze, and visualize traces of your Roku apps to pinpoint where you can reduce resource consumption and optimize performance. Tracing captures and visualizes the events in your app on a timeline, which provides you with a detailed graphical view of what your app is doing over time.
The BrightScript Language extension for VSCode lets you launch your app, record and save a trace, and then view it in Perfetto directly (alternatively, you can use ECP to record a trace and view it in Perfetto). You can then explore the trace in Perfetto by using the WASD keys on your keyboard to zoom and pan, and your mouse to expand process tracks (rows) into their constituent thread tracks. You can also execute SQL-based queries in Perfetto.
Prerequisites
To record a trace, developers need the following:
- Roku OS 15.1 (or later)
- A Roku device with developer mode enabled.
- Roku app (you can record a trace with an app running in a sideloaded, beta, or production environment).
- For a sideloaded app, the manifest must enable the run_as_process attribute (run_as_process=1).
- For a beta or production app, the developer must own the app (your device must be keyed with key used to sign the app package).
- Trace recording app. You can record an app trace using BrightScript Language extension for VSCode or ECP and a websocket client.
Using VSCode to enable and record Perfetto traces
You can enable and record a Perfetto trace with the BrightScript Language extension for VSCode following these steps:
Enabling Perfetto
-
Verify that you have done the following:
- Installed VSCode.
- Installed the latest version of BrightScript Language extension for VSCode.
- Created a launch.json configuration file in your app directory.
- Updated your Roku device to Roku OS 15.2 (or later)
-
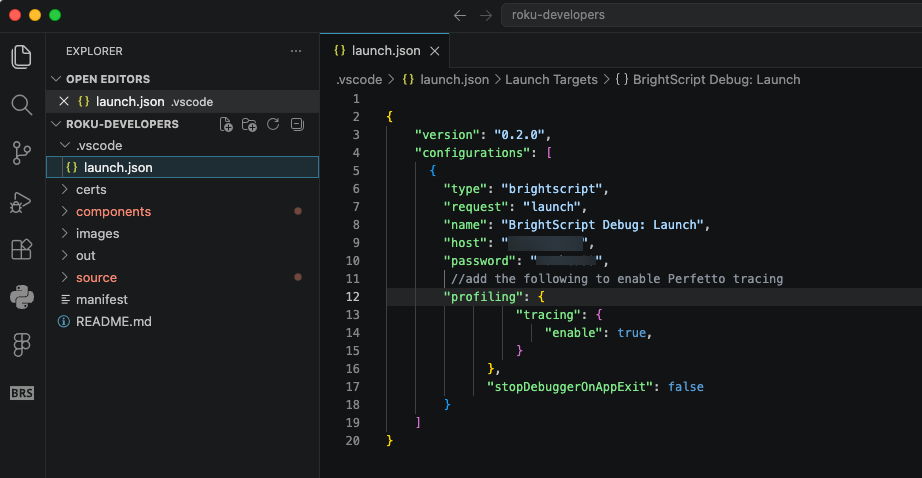
In the launch.json file, add the following profiling object to the configurations object:
{
   "version": "0.2.0",
   "configurations": [
     {
       "type": "brightscript",
       "request": "launch",
       "name": "BrightScript Debug: Launch",
       "host": "<Roku device IP address>",
       "password": "<Roku device password>",

       //add the following to enable Perfetto tracing
       "profiling": {
           "tracing": {
               "enable": true,
           }
         }
       }
   ]
}
Recording a Perfetto trace
To record trace data for a session in VSCode, follow these steps:
-
In VS Code, add your app folder (select File > Open Folder).
-
Select Run>Start Debugging (or press F5) to sideload your app. Tracing begins automatically.
-
Test your app.
-
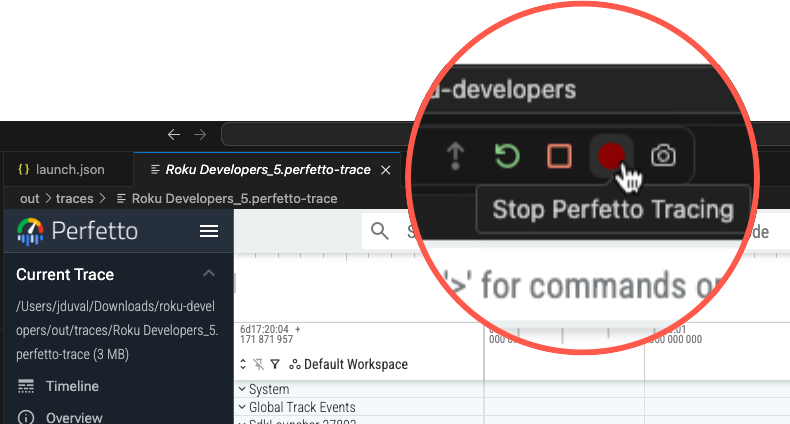
When you are done testing, click the red Stop Perfetto Tracing button.
-
The recorded Perfetto trace opens in a new window. Use the WASD keys on your keyboard to zoom and pan, and use your mouse to expand process tracks (rows) into their constituent thread tracks.
Capturing heap graphs
To capture the BrightScript heap graph, follow these steps:
-
Start recording a trace and test your app.
-
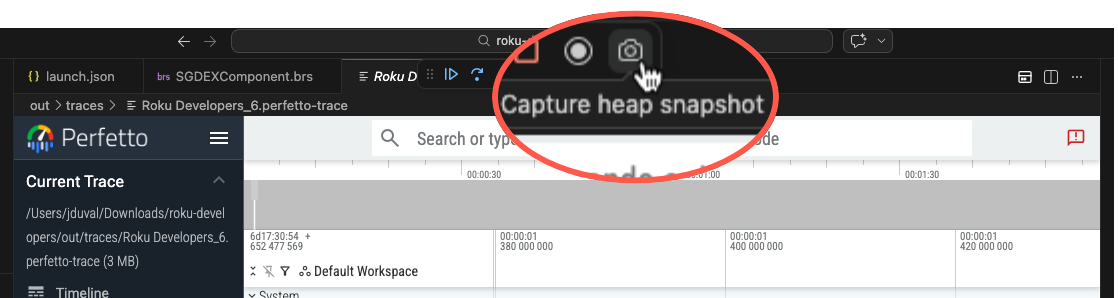
Click the Capture heap snapshot button one or more times during the recording.
-
Click the Stop Perfetto Tracing button when you are done testing.
-
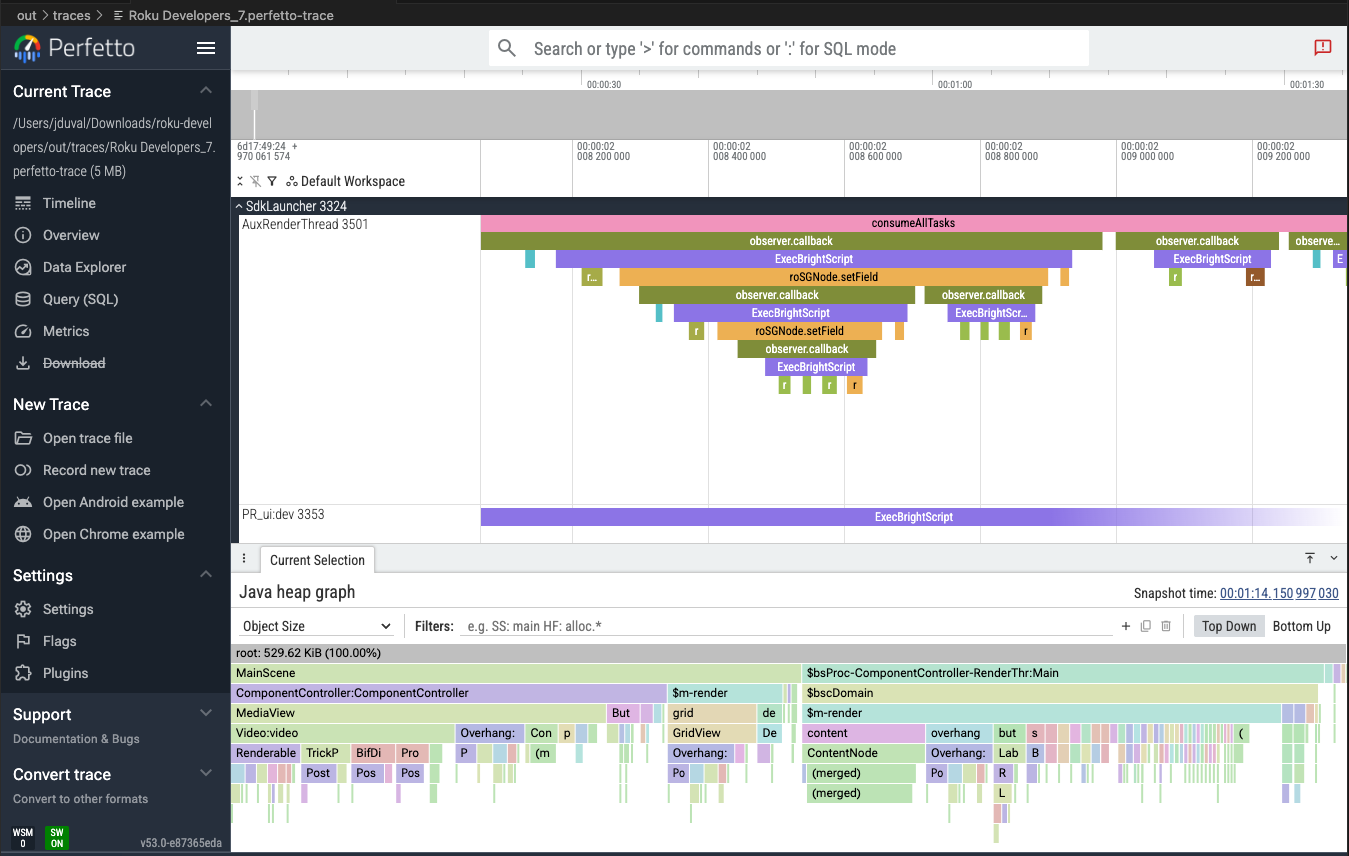
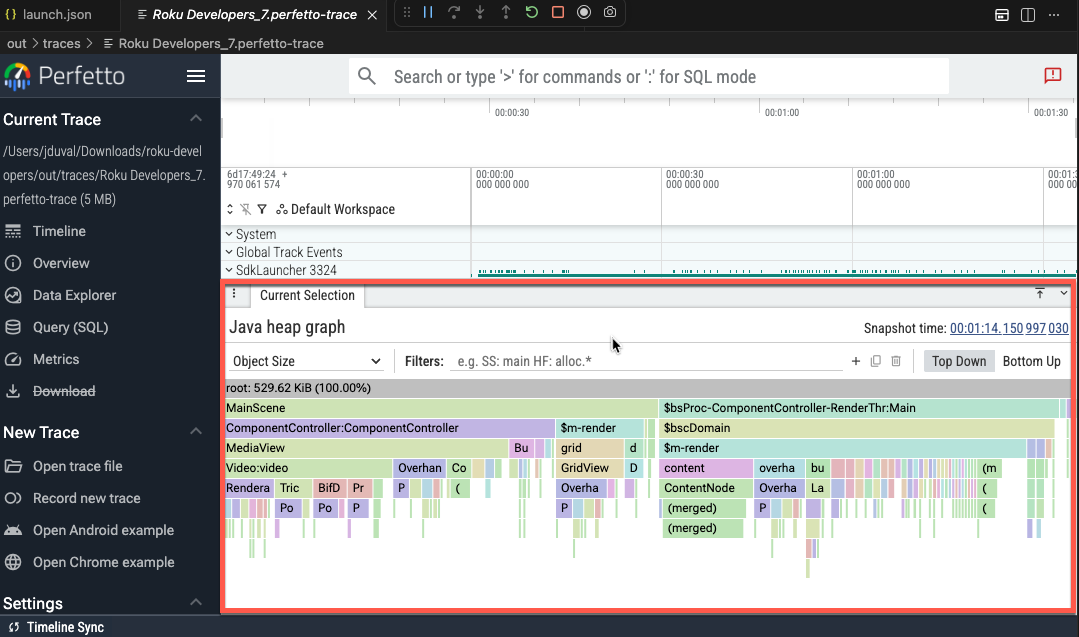
The Java heap graph in the Current Selection tab displays the SceneGraph and BrightScript objects as a flamegraph. You can sort the objects either by allocation size or object count, ordering callstacks from left-to-right according to which have the largest size or count.
-
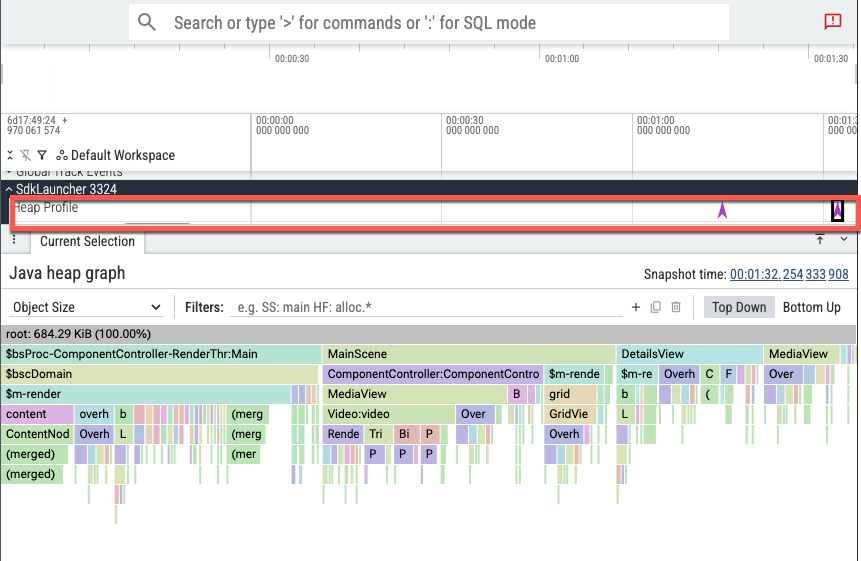
A single Perfetto trace can hold multiple heap graphs, with each heap graph represented by a selectable Heap Profile event.
Shortest Path used to display heap graph
The heap graph is always shown as the shortest path from a root to any given object. This can sometimes lead to charts that might have unexpected structure. For example, if you have a Scene that owns a Grid which in turn owns a ContentNode, you might expect a chart reflecting this:== MyScene ========== -- MyGrid --------- - MyContentNode -However, if there is also a reference to the content node from directly from the domain - perhaps because it is referenced by a local variable, then this path will be preferentially displayed:
Using ECP to enable and record Perfetto traces
You can enable and record a Perfetto trace with ECP following these steps:
Enabling Perfetto
To enable tracing for an app, send the enable Perfetto command with the channel ID:
curl -X POST "http://192.168.1.86:8060/perfetto/enable/dev"The ECP response will have the following syntax:
<?xml version="1.0" encoding="UTF-8" ?>
<perfetto-enable>
  <enabled-channels>
  <channel>dev</channel>
  </enabled-channels>
  <timestamp>1762473265350</timestamp>
  <timestamp-end>1762473265350</timestamp-end>
  <status>OK</status>
</perfetto-enable>
Once enabled, tracing starts automatically each time the app is launched
ECP does not have a corresponding disable Perfetto command. The list of enabled apps is cleared on reboot.
Recording a Perfetto trace
To record trace data for a session, using a websocket client to connect to the device (for example, websocat). The websocket emits a stream of bytes, which is the Protobuf-encoded Perfetto trace from the device.
websocat --binary ws://$ip:8060/perfetto-session > perfetto_data.traceData stops streaming when the client disconnects. If the client reconnects, the stream resumes.
Roku only supports a single websocket connection at a time.
Visualizing trace files in Perfetto
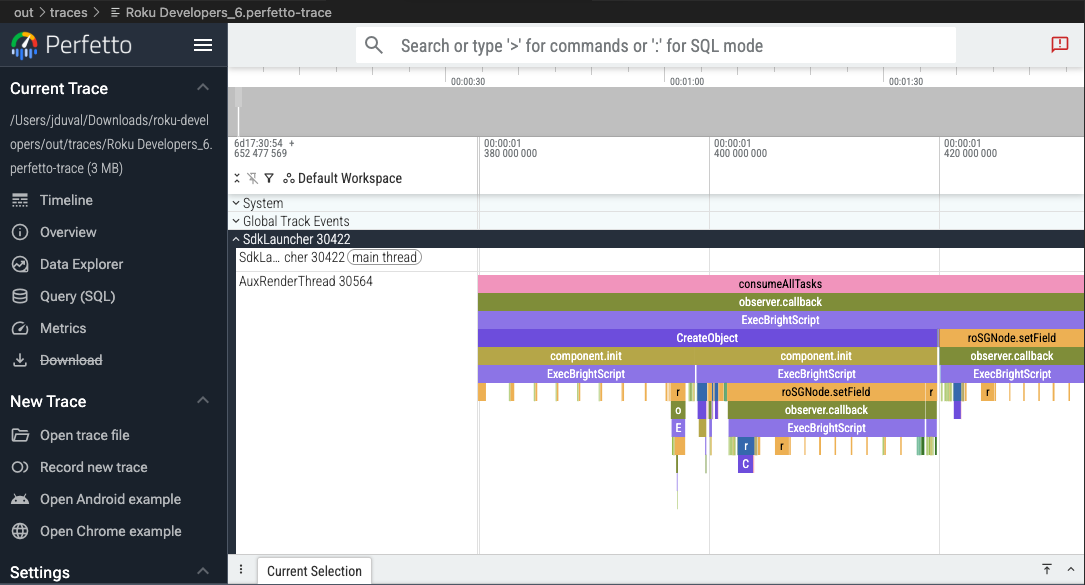
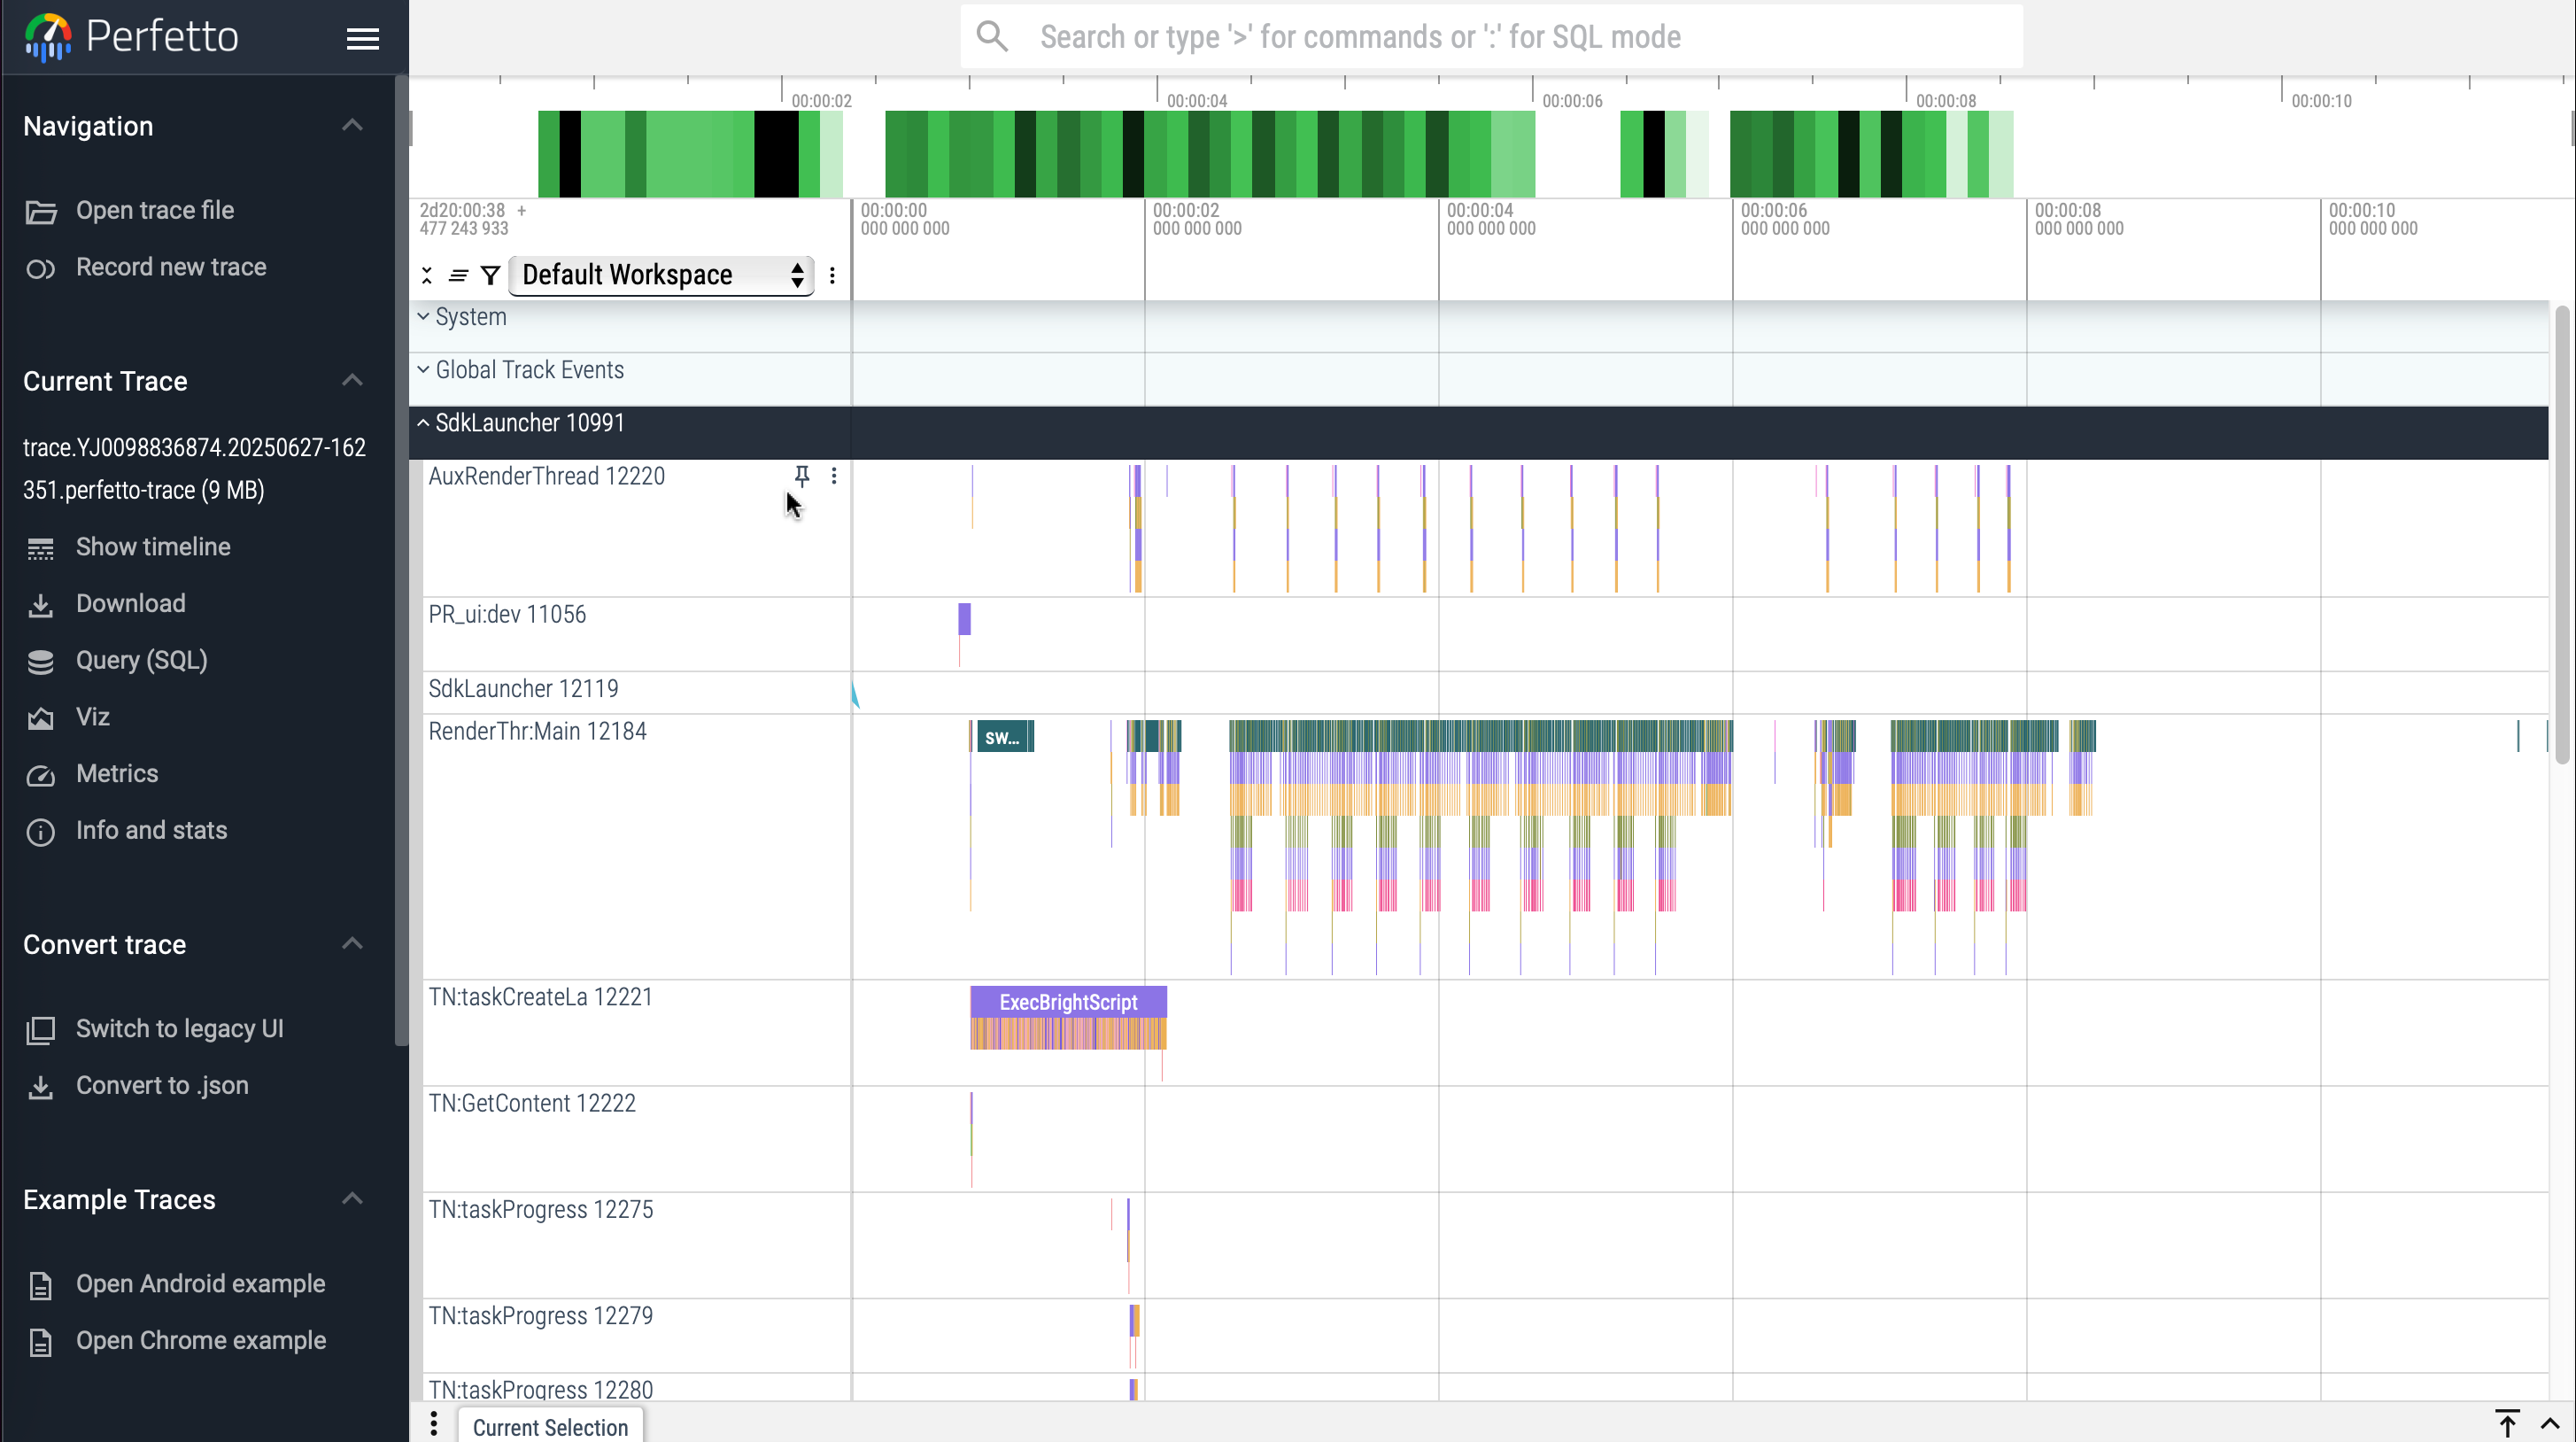
You can open trace files with the Perfetto UI to analyze them and pinpoint potential optimizations. Perfetto features a timeline view that provides a visual representation of the trace.
You can use the W,A,S,D keys on your keyboard to zoom and pan, and your mouse to expand process tracks (rows) into their constituent thread tracks.
Adding custom trace data
You can use the roPerfetto BrightScript component to capture custom events in a Perfetto trace. The types of events you can record include instantaneous, duration, scoped, and flow events.
| Event | Description | Example | Snippet |
|---|---|---|---|
Instantaneous | Events without a duration | keypress | | Creation of a “flow” of events from one piece of code to another.A Task thread to the Render thread.
Using PerfettoSQL to query traces
You can query the data in a trace using PerfettoSQL following these steps:
- Click Query (SQL) in the left sidebar in the Perfetto UI.
- Enter your query in the editor.
- Click Run Query.
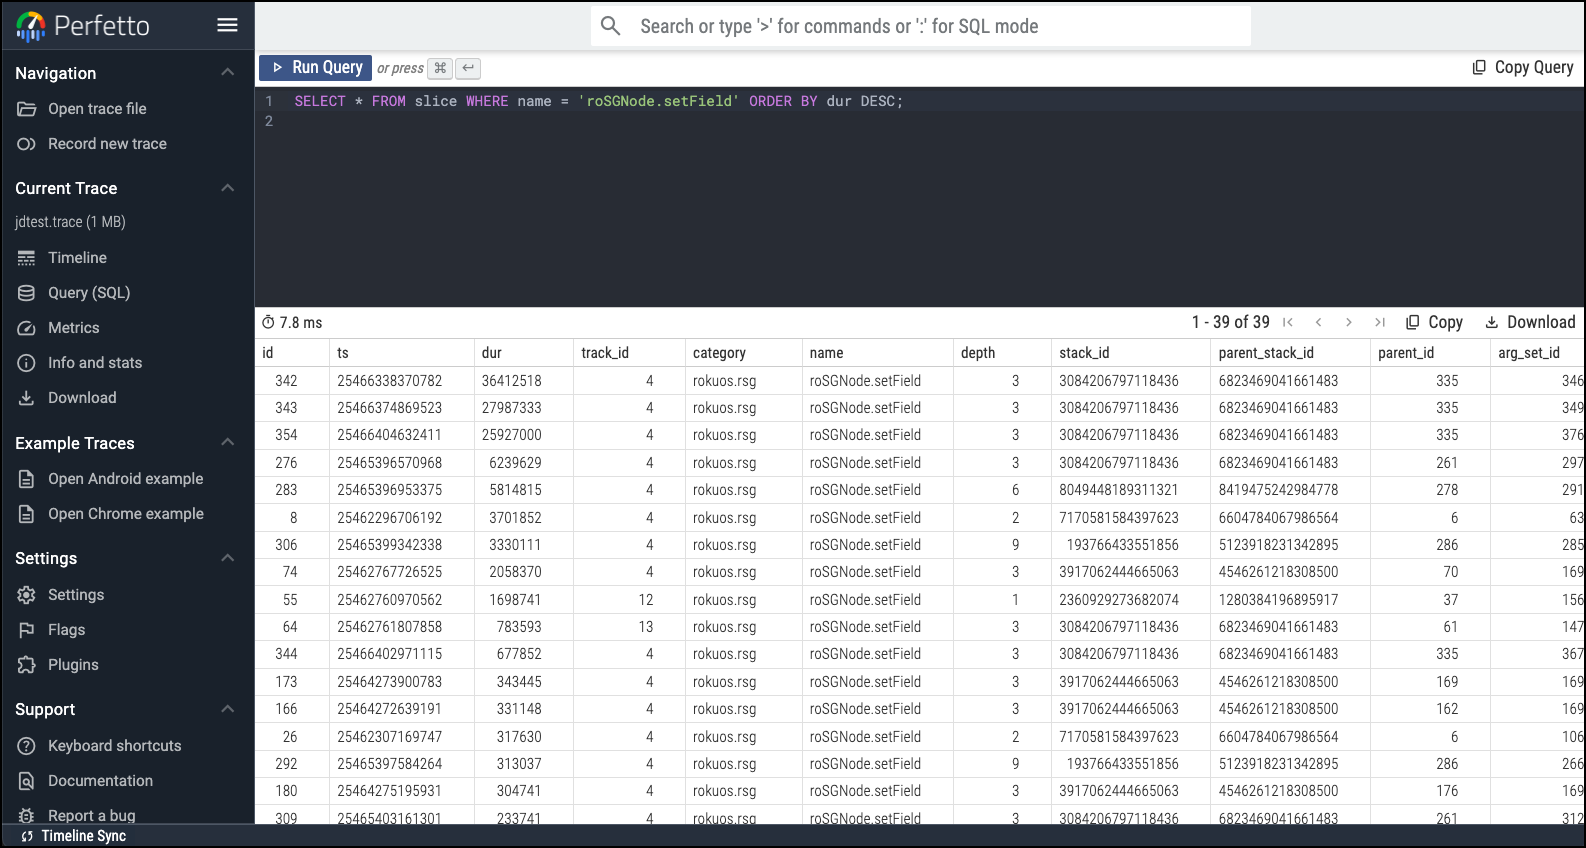
The following examples demonstrate some of the use cases for querying your trace data:
| Use case | Query |
|---|---|
| Find all rendezvous in order of duration (long rendezvous often cause dropped frames and may indicate inefficient observer functions). | SELECT * FROM slices WHERE name = 'rendezvous' ORDER BY dur DESC; |
| Find long executions of swapBuffers which indicate places where the app may be dropping frames | SELECT * FROM slice WHERE name = 'swapBuffers' ORDER BY dur DESC; |
Find places where the app is handling a key press with OnKeyEvent() | SELECT * FROM slice WHERE name = 'keyEvent' ORDER BY dur DESC; |
| Find all of the observers being called in the app. | SELECT * FROM slice WHERE name = 'observer.callback' ORDER BY dur DESC; |
Find all of the places where the app is calling setField. | SELECT * FROM slice WHERE name = 'roSGNode.setField' ORDER BY dur DESC; |
Glossary
Roku's Perfetto-based app tracing solution exposes a number of terms that Roku developers may be unfamiliar with:
| Term | Defintion |
|---|---|
| SdkLauncher | A Roku OS plugin that provides an environment for running SDK apps in a sandboxed process. |
| PR_ui | The main BrightScript thread. |
| RenderThread | The primary SceneGraph render thread. |
| AuxRenderThread | A Roku OS thread used to offload some rendering tasks from the main UI thread. This helps improve the responsiveness and smoothness of the user interface. |
| TN:[function name] | A Task thread spawned by a Task node . The function name represents the name of the Task function defined by the app. |
| ExecBrightScript | A slice representing the BrightScript engine processing app code. |
| render | A slice representing the process of drawing or composing a frame for display. |
| swapBuffers | A slice representing the operation of presenting a newly rendered frame to the display. |
| consumeAllTasks | A slice representing the render thread as it is processing messages from the Render Thread Queue that are waiting. These can include rendezvous as well as messages sent using the roRenderThreadQueue component. |
| bscCopyToDomainEx | A slice representing data being copied. For example, when getting or setting a field on a Task node from the Render thread. |
Video tutorial
This following video demonstrates how you can use Perfetto to record, analyze, and visualize traces of your Roku apps to pinpoint where you can reduce resource consumption and optimize performance.
Updated 2 months ago