
Cancellation Offers Report
See how viewers move through the cancellation flow and how retention offers perform for your app
You can use the Cancellation Offers Report to see how many viewers enter the manage-subscription/cancellation experience, how many are shown a retention offer, what viewers do after seeing an offer (accept, cancel anyway, or take no action), and which offers are ultimately redeemed by plan and currency.
This report is especially useful for evaluating the health of your retention strategy: whether offers are reaching the right viewers, how effective they are at preventing churn, and which price points and billing cadences drive the most redemptions. Reviewing these trends week over week helps you spot shifts in cancellation behavior early and adjust your offer strategy before churn accelerates.
Filters
The filters applied to this report are:
-
Channel ID: Identifies the app whose cancellation and offer data you want to analyze. A Channel ID is required for the report to return data.
-
Date Filter: Sets the data sample period for the entire report (for example, "is in the last 30 days" or a custom date range). All visualizations are aggregated by week (Date Key Week) within the selected period.
Visualizations
The report includes the following charts:
- Retention: Track the cancellation and acceptance funnel daily.
- Cancellation flow metrics: Daily cancellation initiation events, and how many of those viewers are shown a retention offer versus not shown one.
- Daily offer acceptance: Of the viewers shown a cancel offer, how many accept it each day.
- Redemption: Track redemptions and product-level performance over a 30-day window
- Daily offer redemptions: The total number of retention offers redeemed each day.
- Offer acceptance by product: How many users see a cancel offer and how many accept it, broken down by product SKU.
- Offer redemptions by product and country: Cancellation offer redemptions by SKU, with duration, country, and discount interval type.
You can click any item in the legend at the bottom of a chart to isolate or combine metrics.
Some legend labels use internal shorthand ("AR" refers to auto-renew). The plain-language definition beneath each label explains what the metric represents from the viewer's perspective.
Cancellation flow metrics
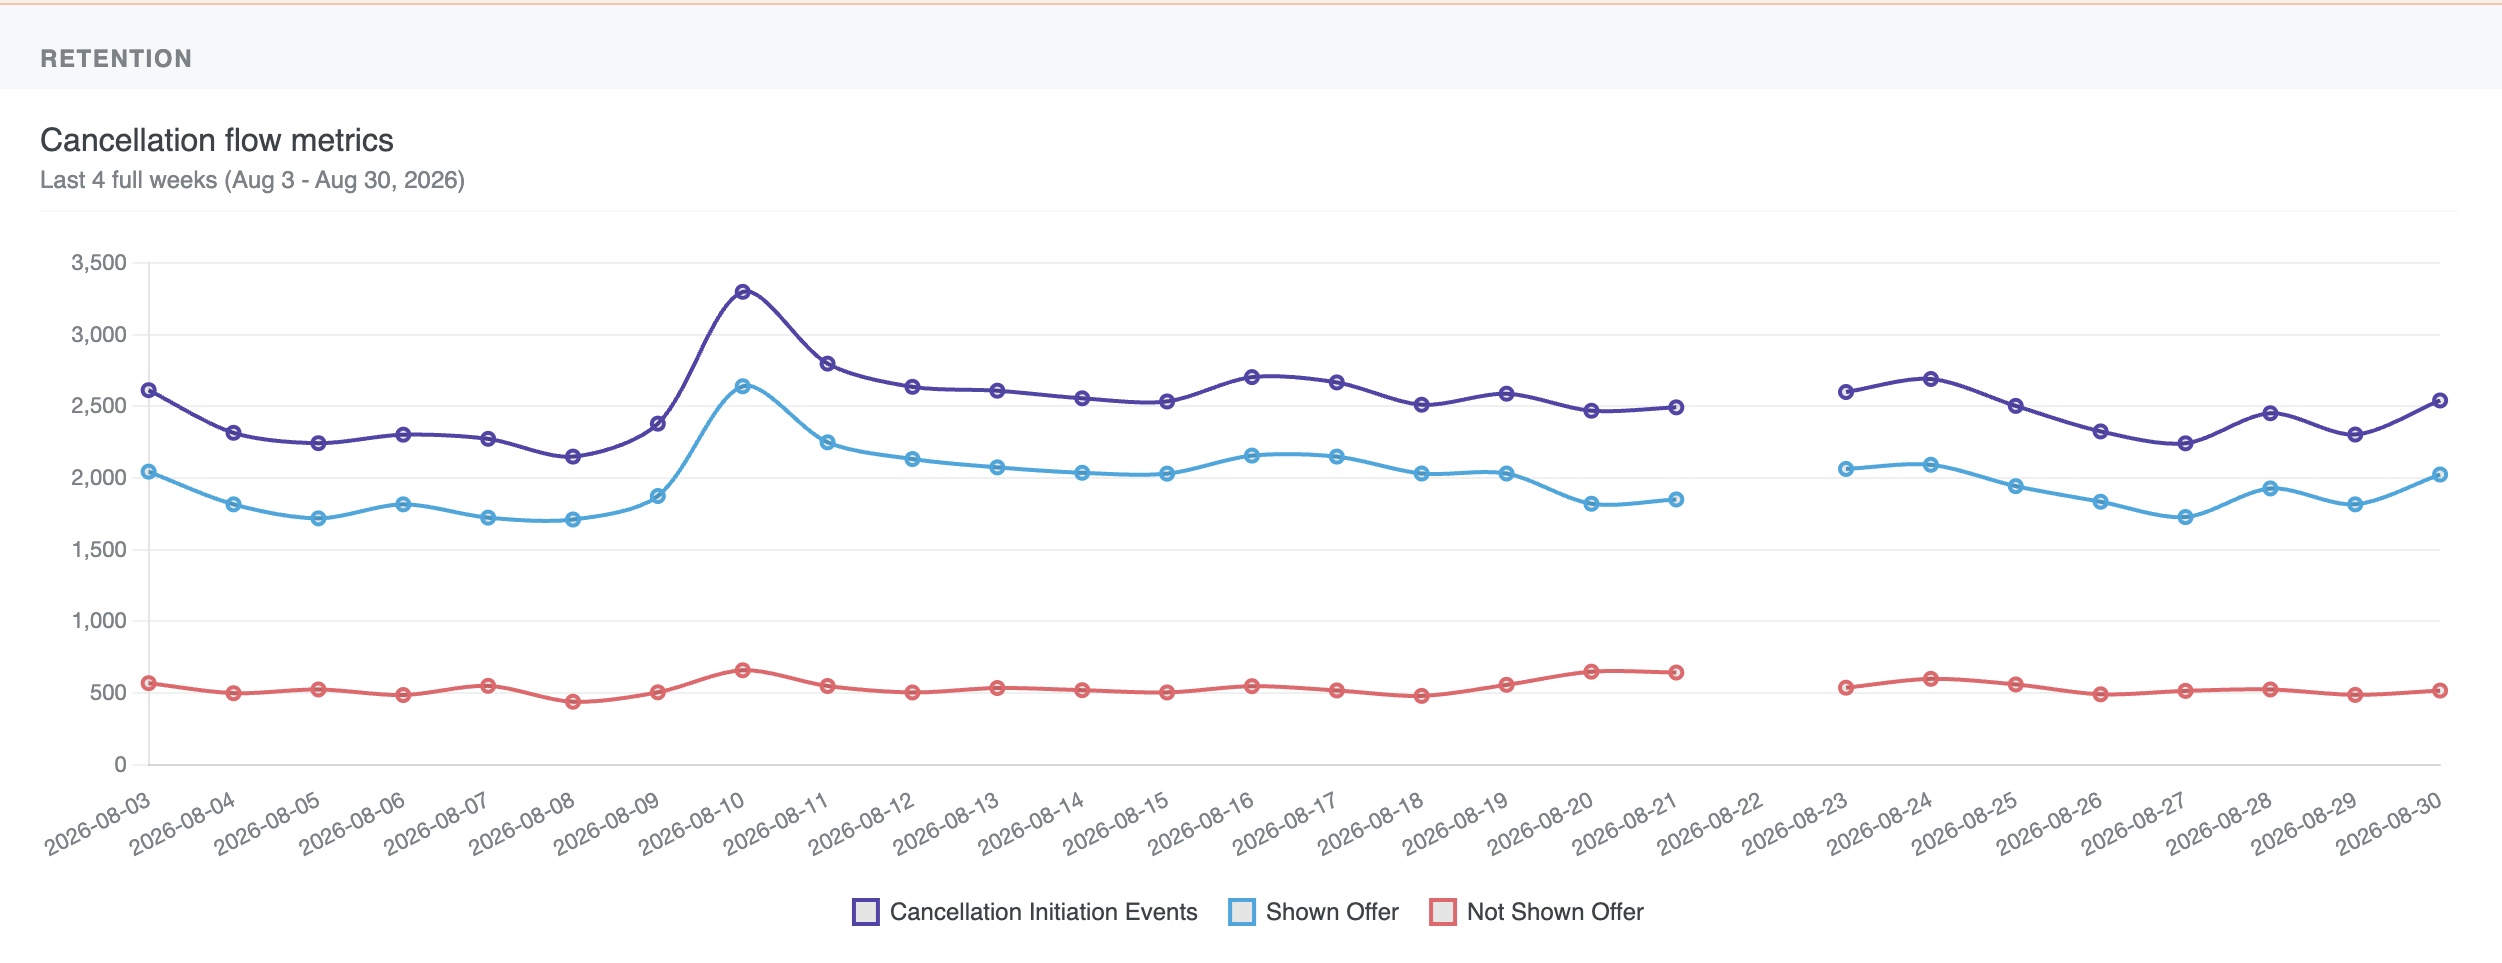
This chart tracks the top of the retention funnel: how many viewers start the cancellation flow each day, and whether they see a retention offer during that flow, over the last 4 full weeks.
-
Cancellation Initiation Events: The number of viewers who started the cancellation flow that day.
-
Shown Offer: Viewers who were presented with a retention offer during that flow.
-
Not Shown Offer: Viewers who went through the cancellation flow without seeing a retention offer.
Daily offer acceptance
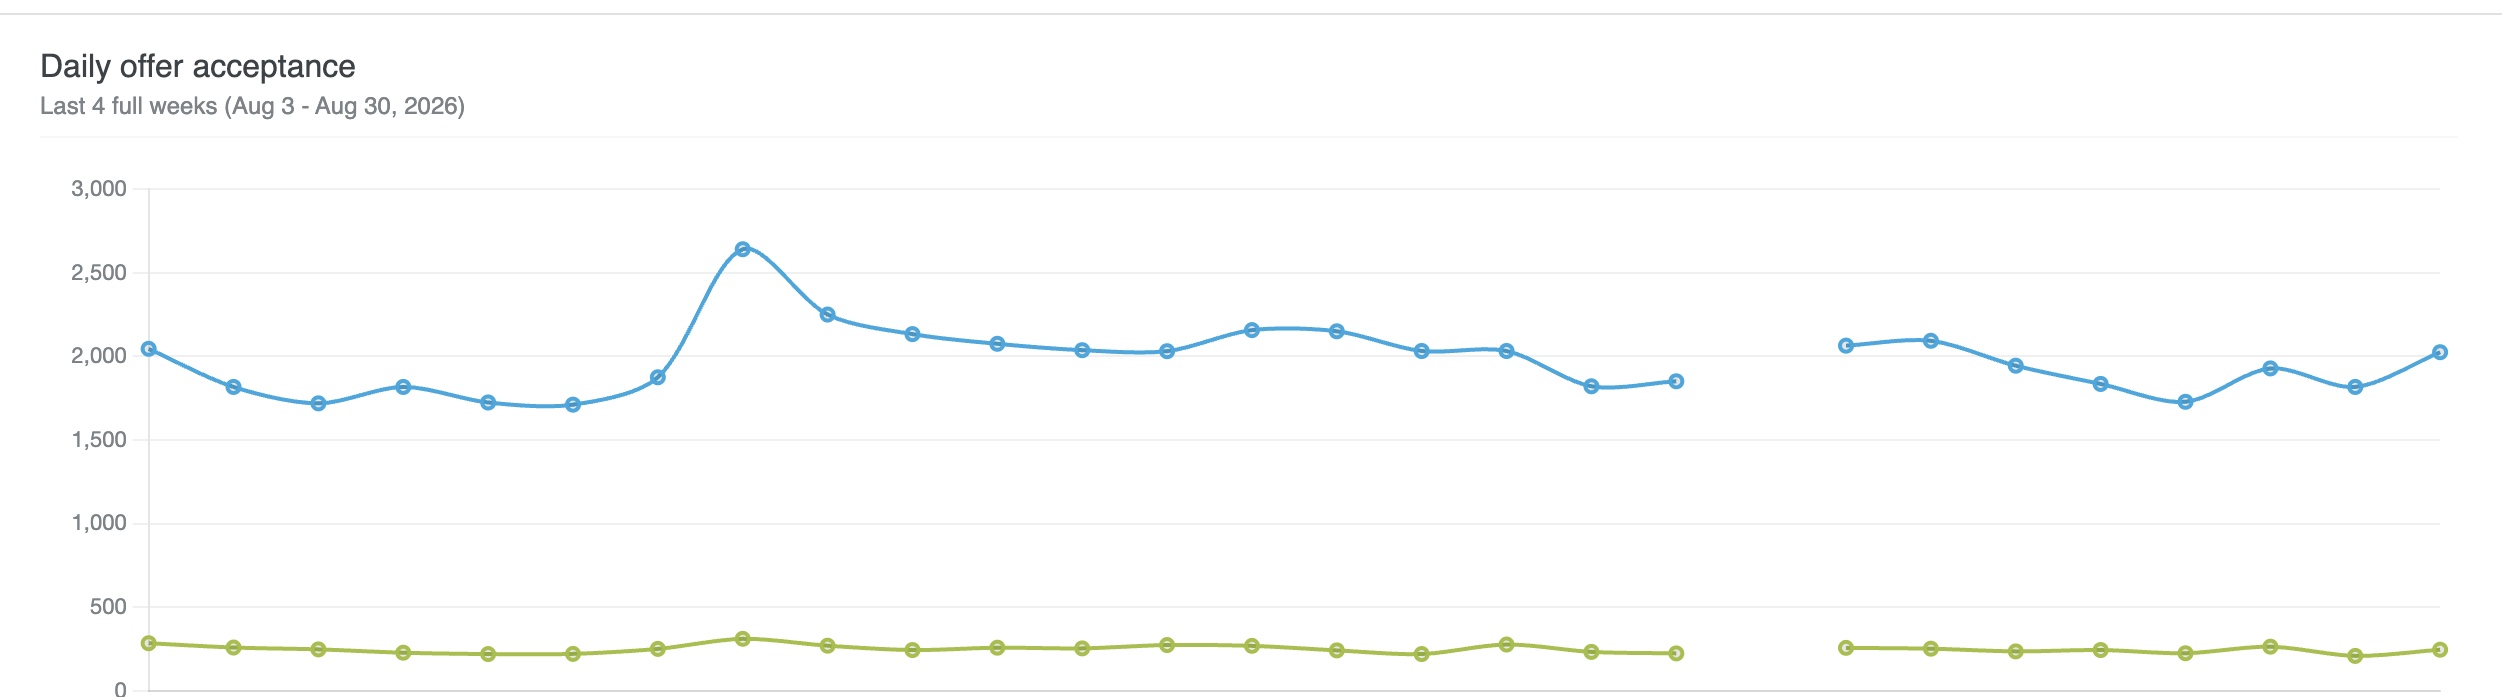
Of the viewers shown a retention offer, this chart tracks how many accept it, day by day, over the last 4 full weeks.
-
Shown Offer: The daily count of viewers shown an offer (repeated here for reference).
-
Accepted Offer: The daily count of viewers who accepted the offer they were shown.
Daily offer redemptions
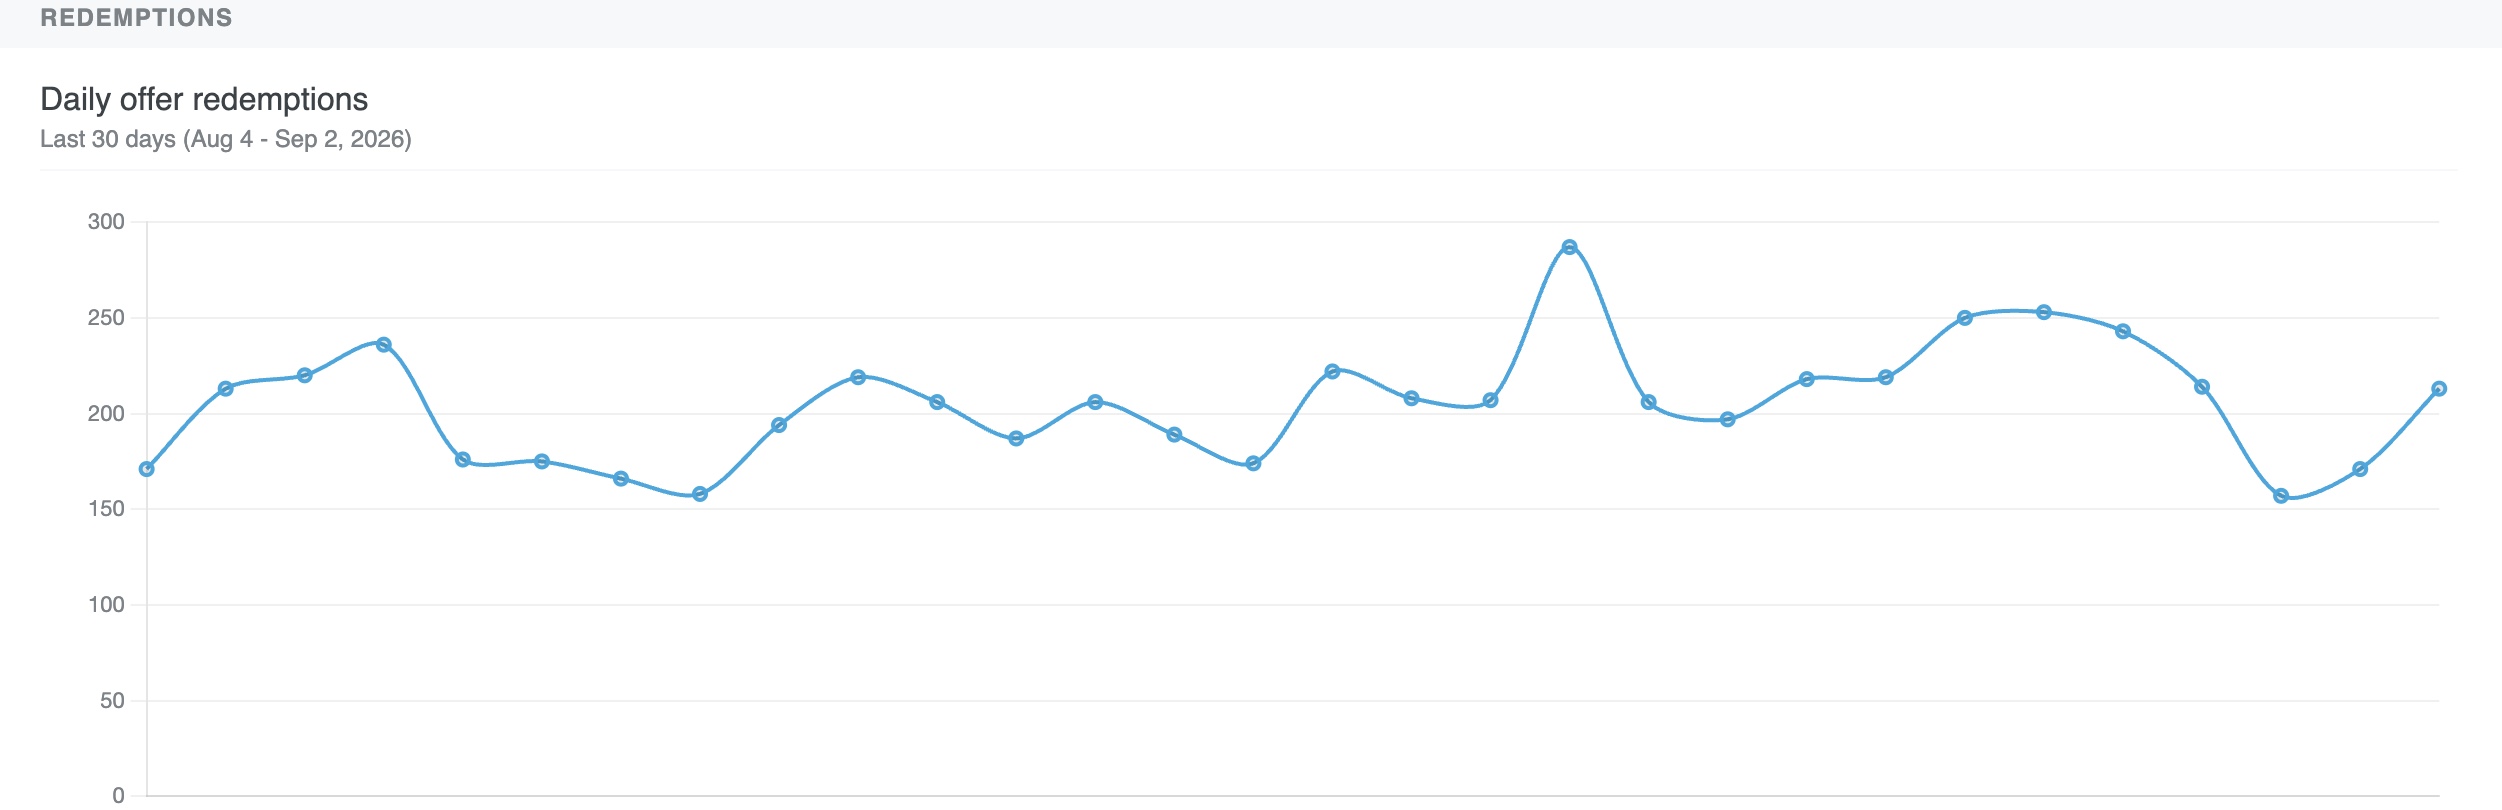
Tracks how many accepted offers are ultimately redeemed, aggregated across all products and countries, over the last 30 days. Use this alongside "Offer acceptance by product" and "Offer redemptions by product and country" to see which products and countries drive the totals shown here.
- Offer Redemptions: The total number of retention offers redeemed that day, across all products.
Offer acceptance by product
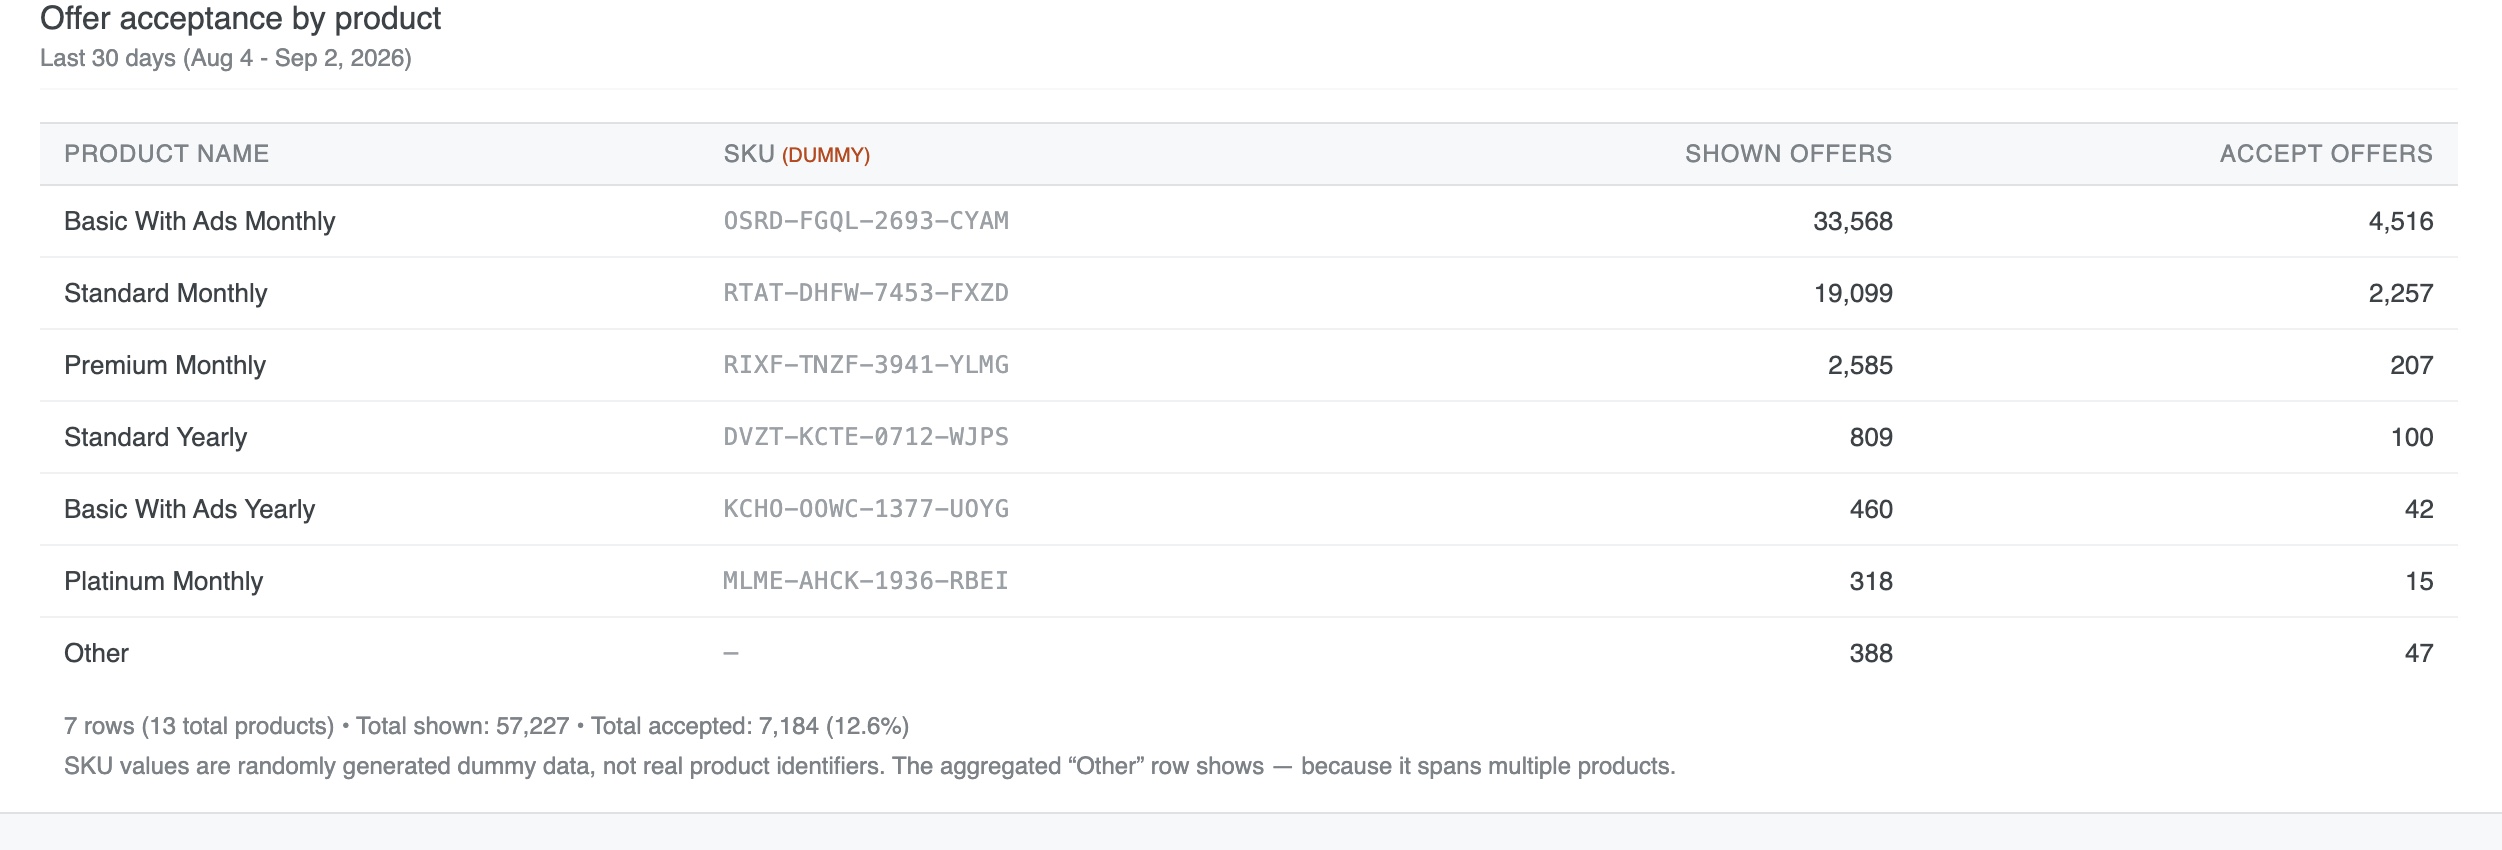
This table breaks offer performance down by product so you can see which plans see the most offers and which convert best, over the last 30 days.
-
Product Name: The subscription plan the offer was shown against.
-
SKU: A per-product identifier. The aggregated "Other" row has no SKU since it spans multiple products.
-
Shown Offers: The number of viewers on that product shown a retention offer.
-
Accept Offers: The number of viewers on that product who accepted the offer.
The table shows the top seven products individually; the remaining products roll up into an "Other" row.
Offer redemptions by product and country
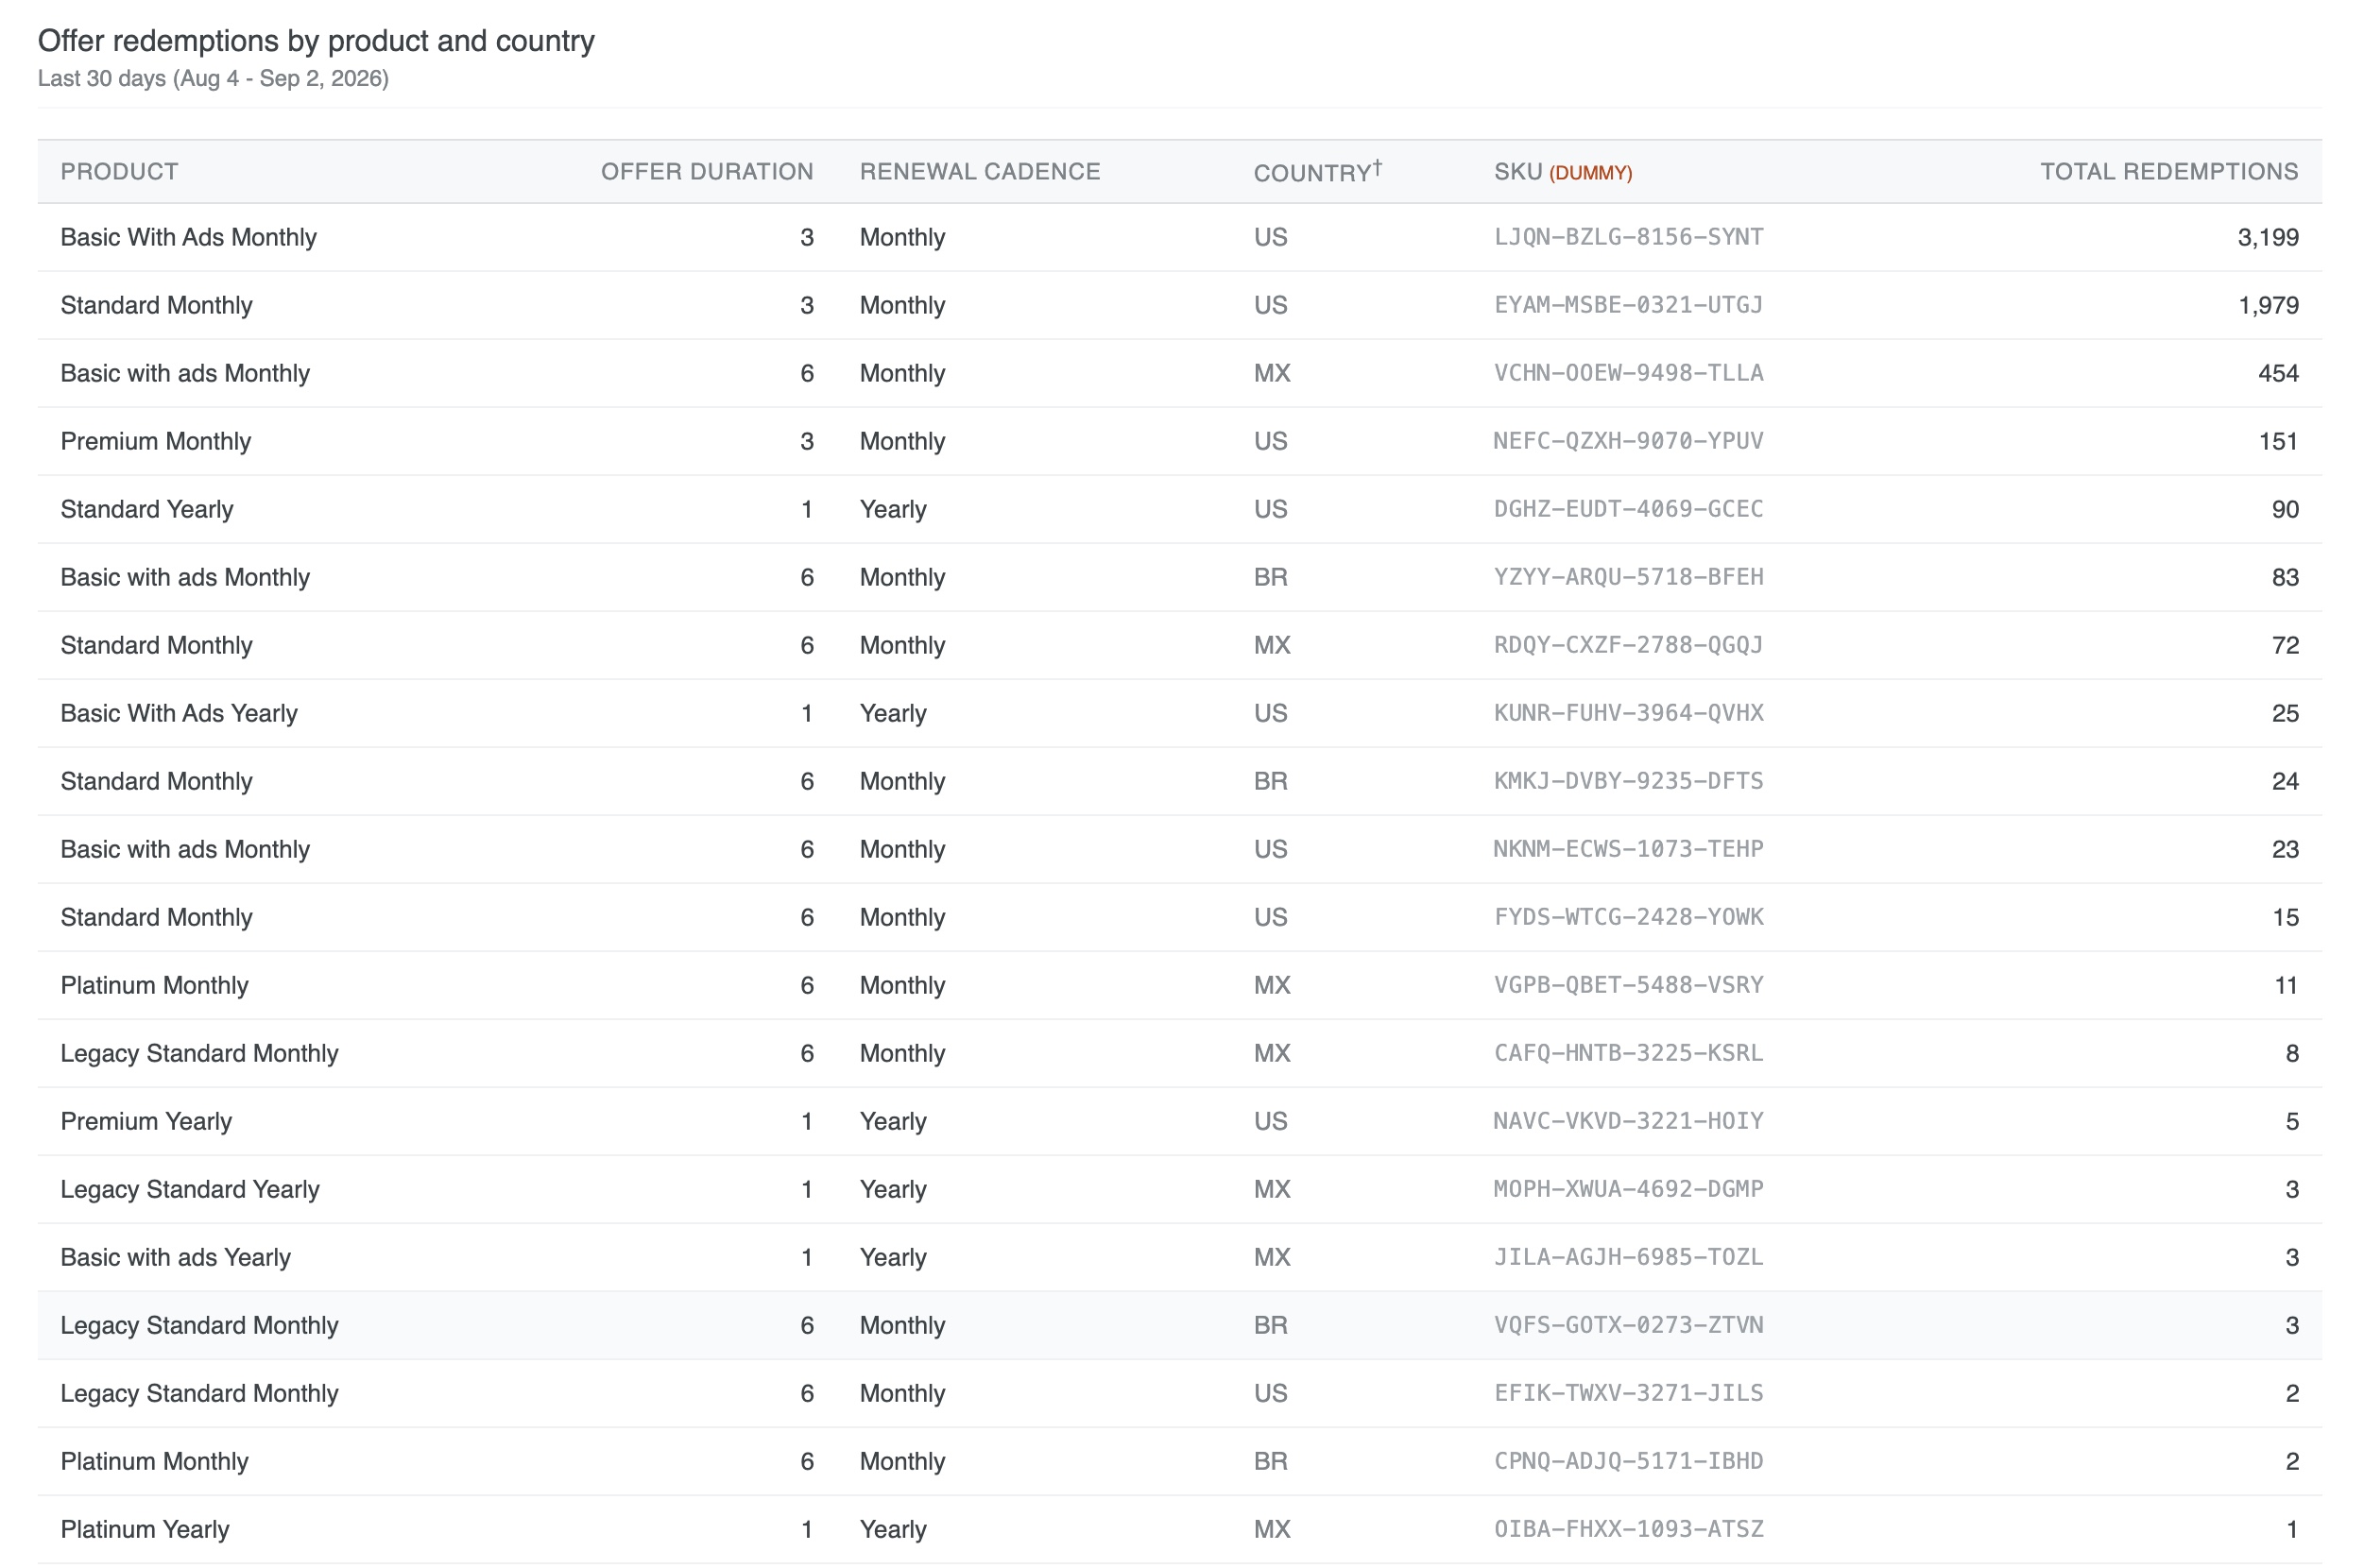
Use this table to assess how discount offers are performing against different products, so you can tell whether the discount itself is what's driving the save, over the last 30 days.
-
Product: The subscription plan the redeemed offer applied to.
-
Offer Duration: The length of the discount interval, in months.
-
Renewal Cadence: How often the underlying plan renews, Monthly or Yearly.
-
Country: The viewer's country.
-
SKU: A per-product identifier.
-
Total Redemptions: The number of times that product/duration/cadence/country combination was redeemed in the period.
Updated 8 days ago